Legend: Upper graph of each pair is motor speed V (proportional to edot); lower graph is load (in volts). Translate motor V to edot thus: V1.00 ≈ 6e-6/s ≈ 2%/hr. Load to stress translation for ice767 is roughly ____ MPa/mV, with a __ mV zero offset. Horizontal scale is time. 5000 ≈ 14 hrs.
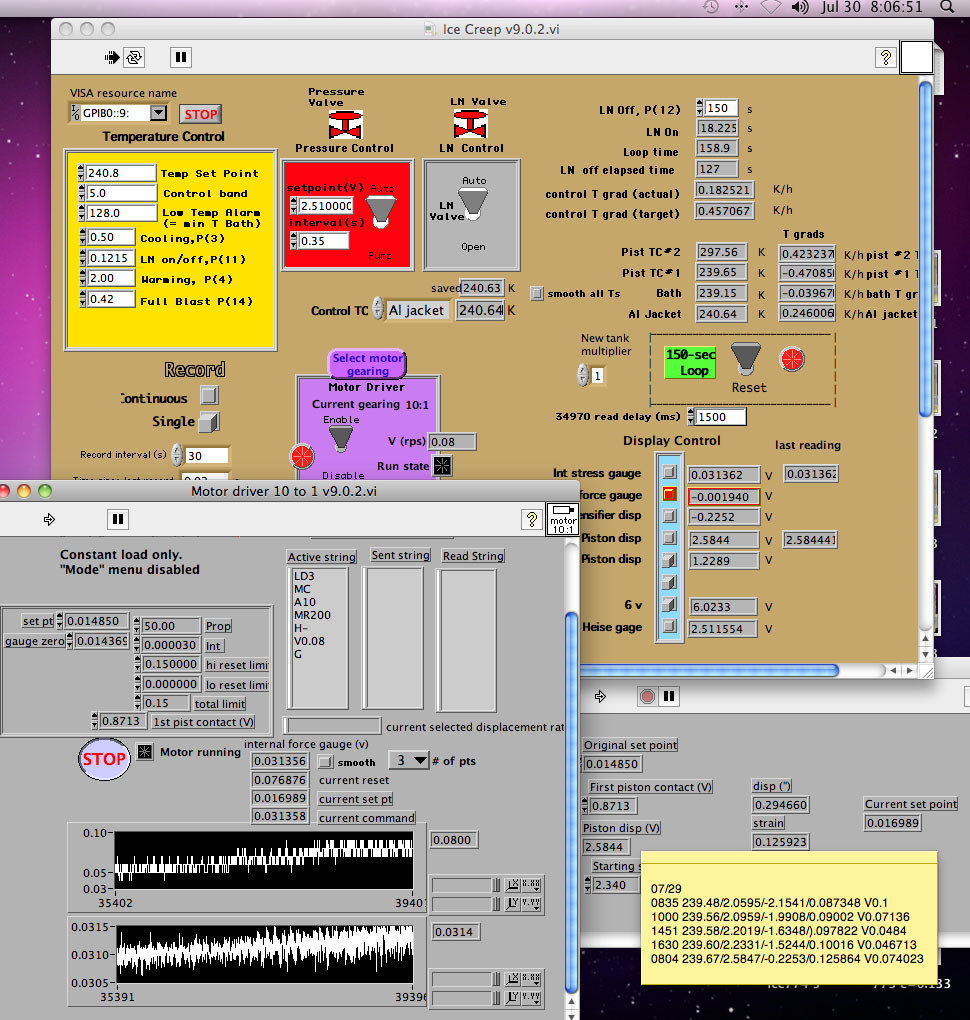
End of run. Force gage zero drift accounts only for a ~20% rise in udot, whereas actual is more like a doubling. Await data reduction for truth.
7/30/14 0806 hrs
Update: force gage drift correction done just now is consistent with a 25% increase in edot; explains some of the softening.
7/29/14 1200 hrs
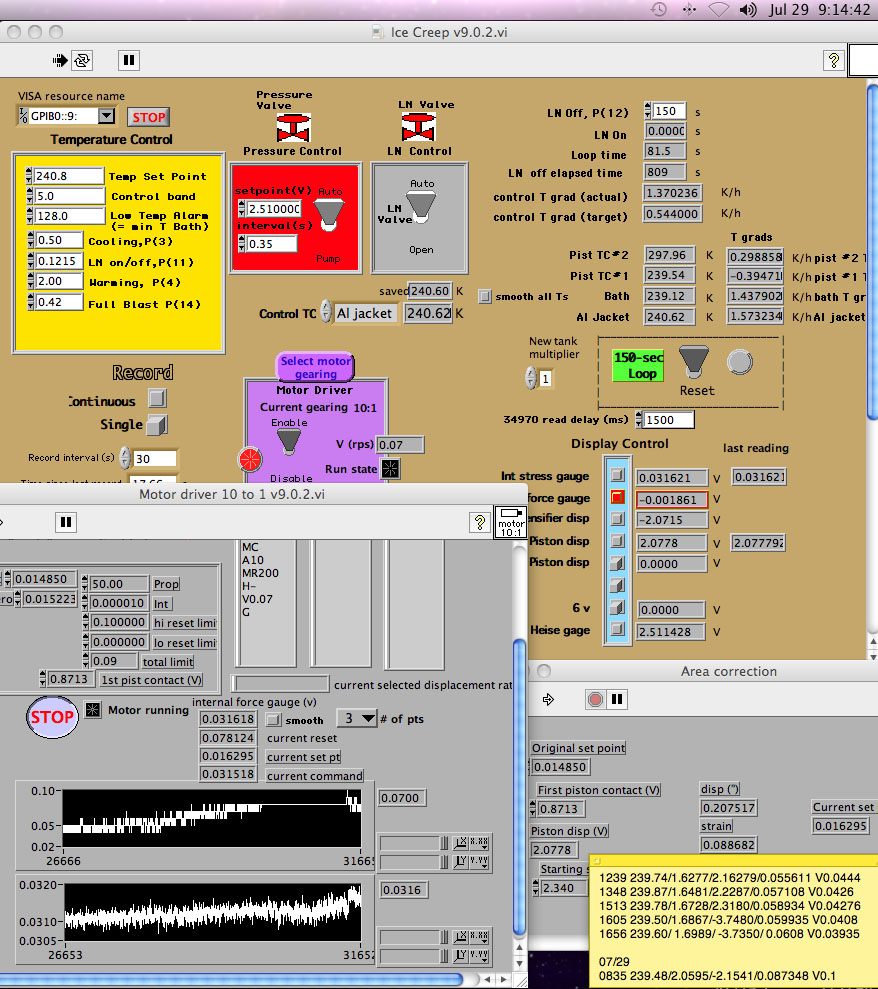
Lookee here! e softening a bit overnight (or is it just severe gage zero drift? Seems unlikely, but time will tell). udot hit V0.10 limit for a while; record shows how limit was raised so that s could recover back up to 3 MPa.
7/29/31 0914 hrs

e = 0.054
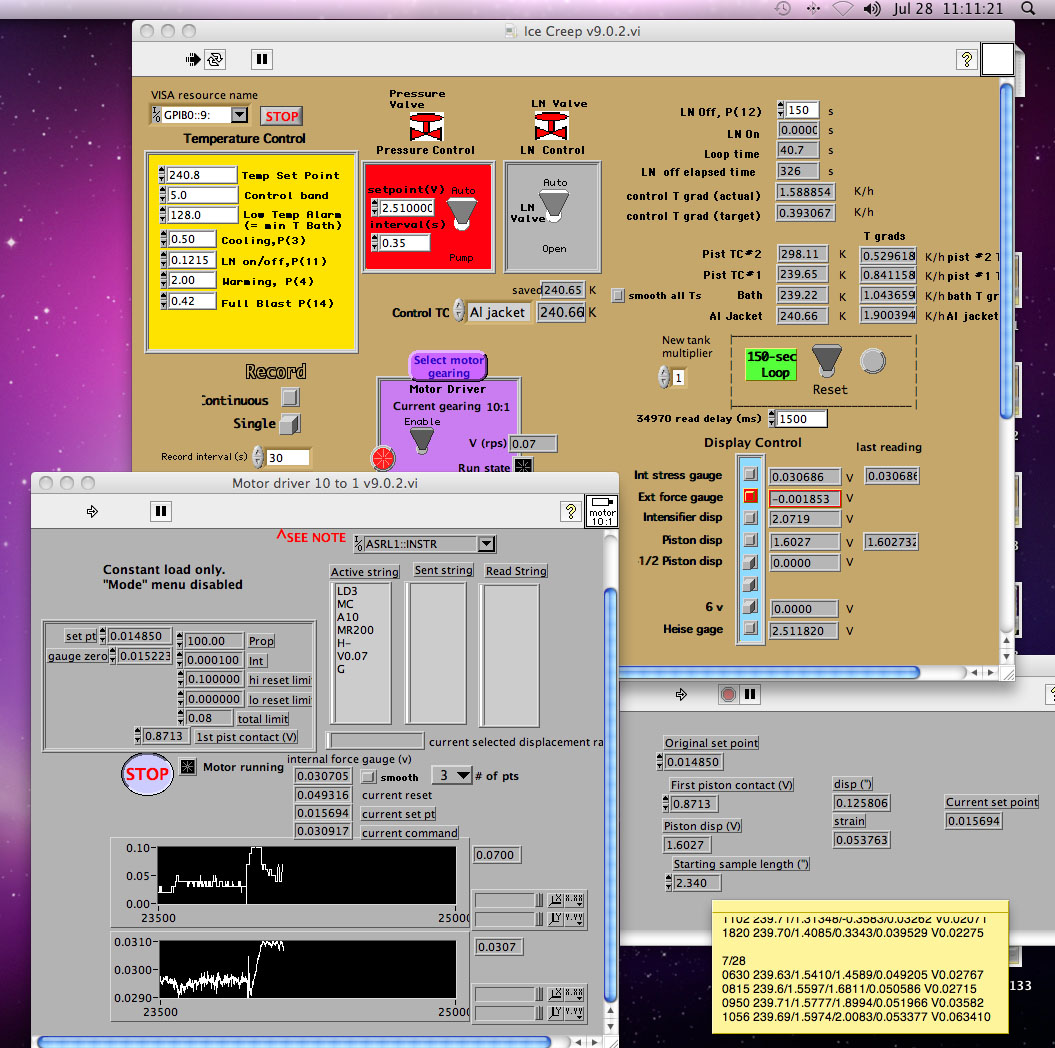
Detail of zero check of force gage. Slight drift correction after check raises the target a hair.
7/28/14 1111 hrs
Now at 5% strain and strain rate still bears no resemblance to the very much higher rate of 773. At what strain can we decide that weakening is just not going to appear here?
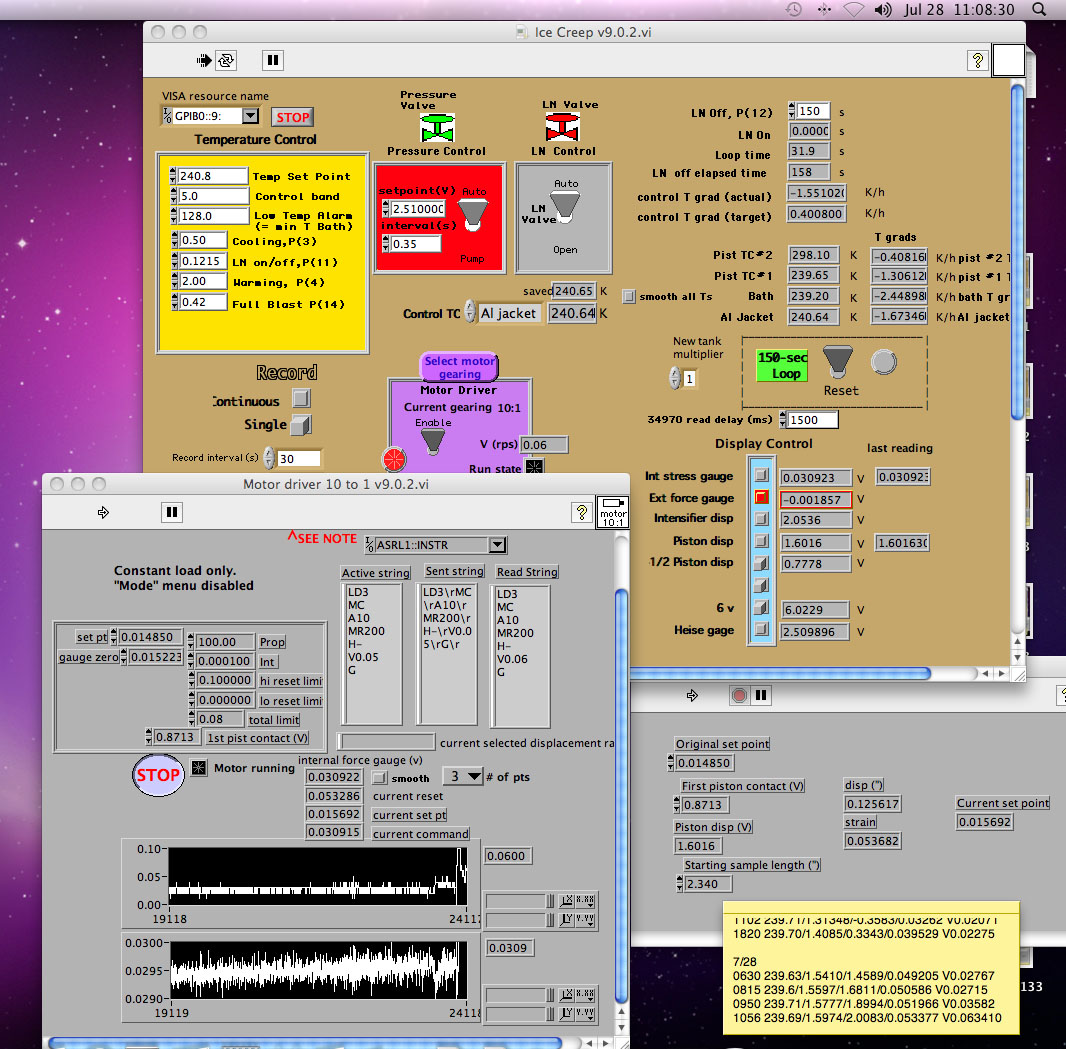
7/28/14 1108 hrs
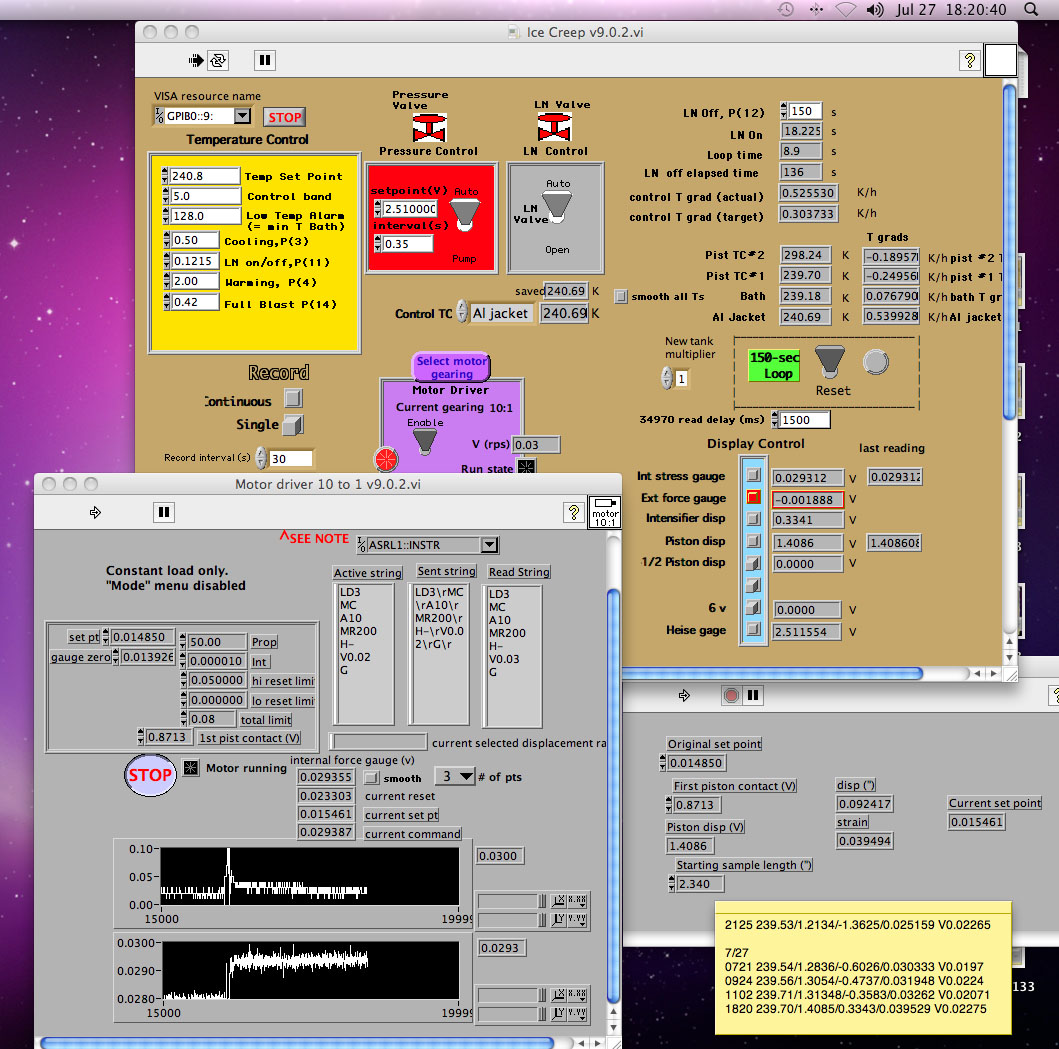
7/2/14 1820 hrs
Still pan flat.
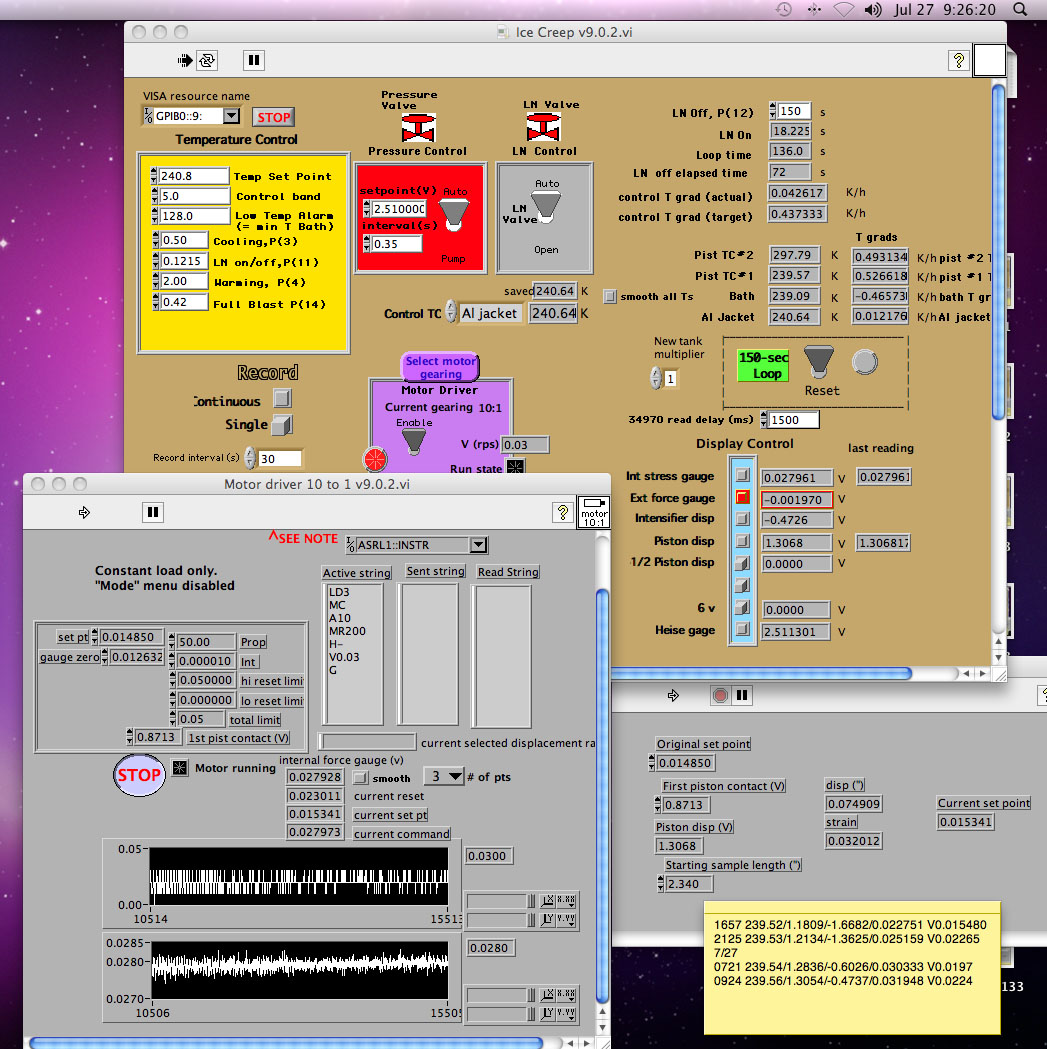
7/27/14 0926 hrs
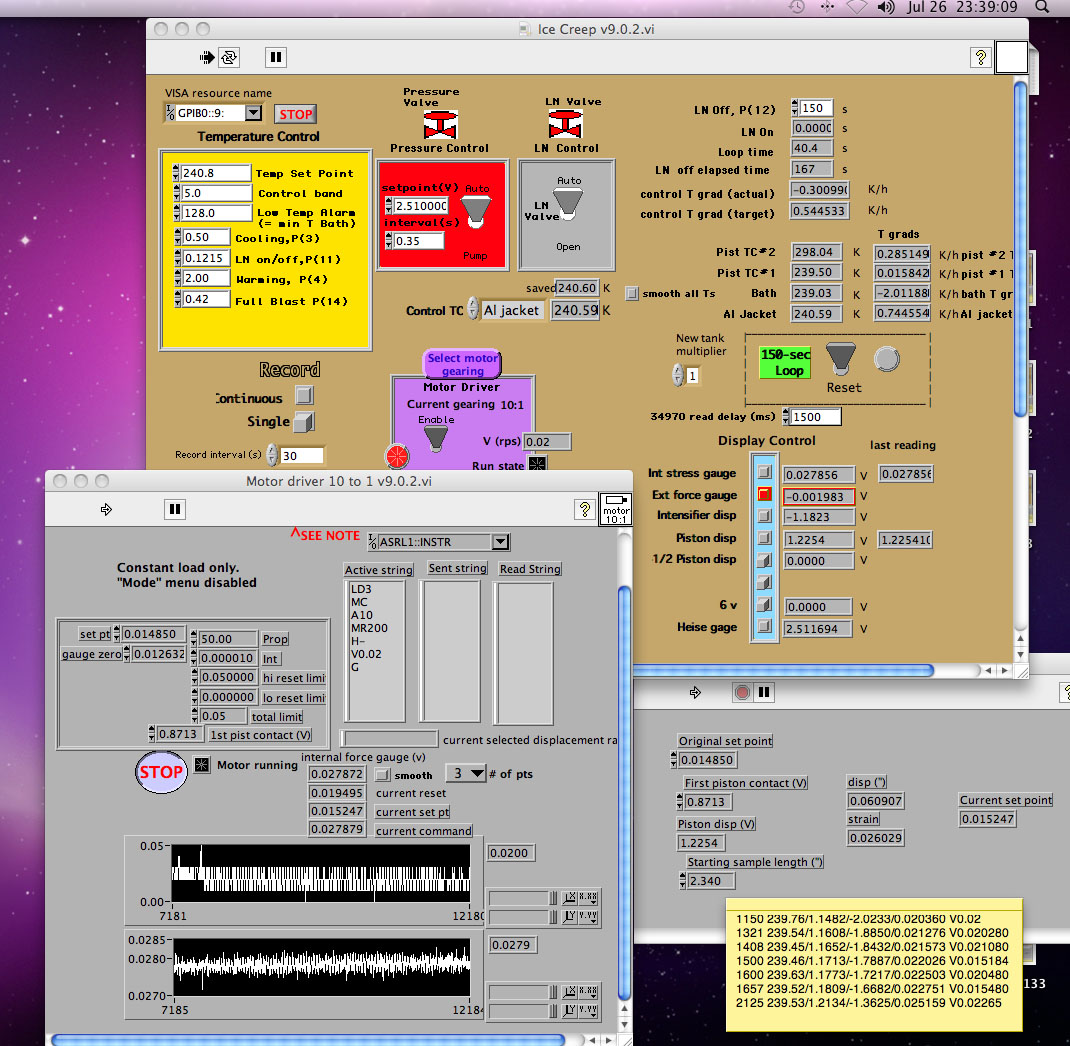
7/26/14 2339 hrs
edot way lower than in 773...
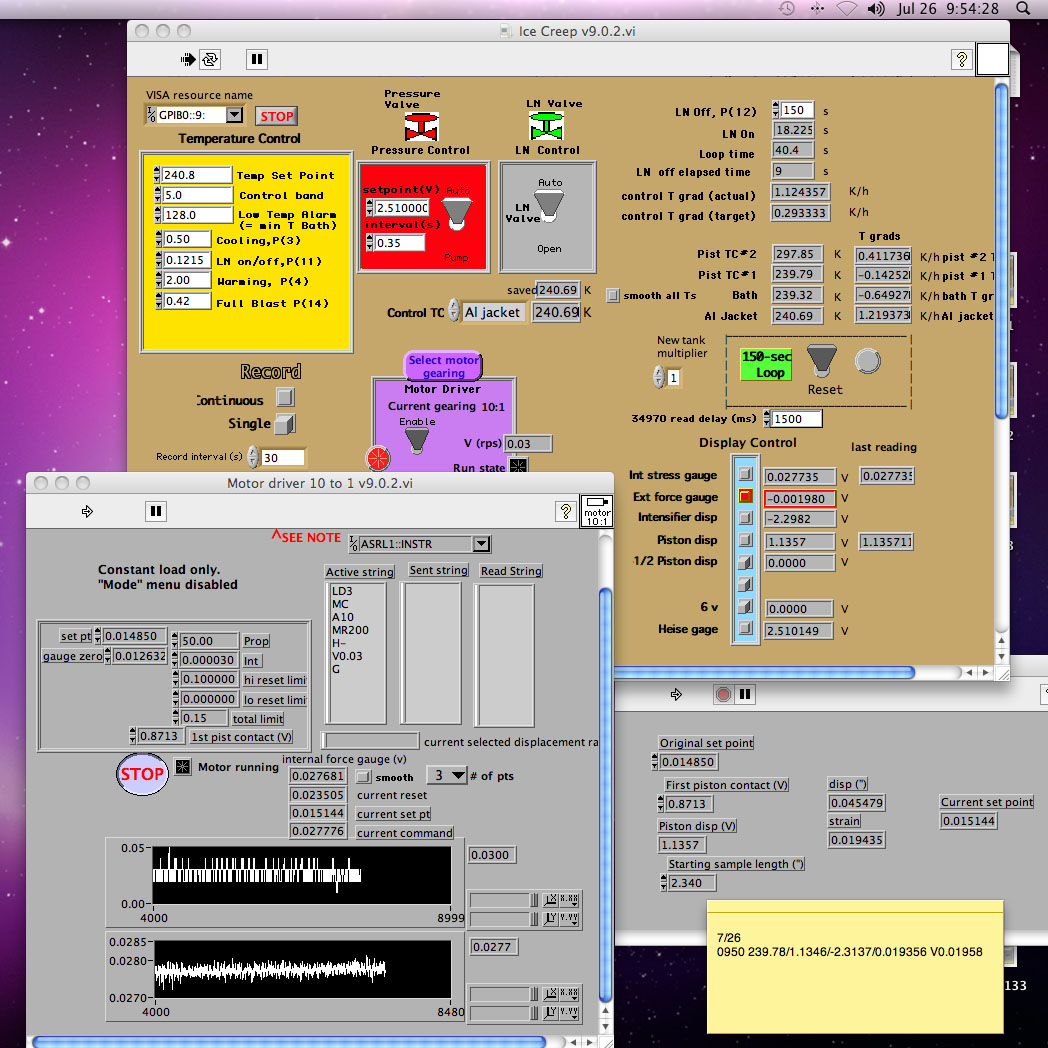
7/26/14 0954 hrs
Underway. Plan is to run single step creep at 3 MPa to e ~ 0.20, for eventual microstructural comparison with 773 at ~same e, but with a big s drop in its history.
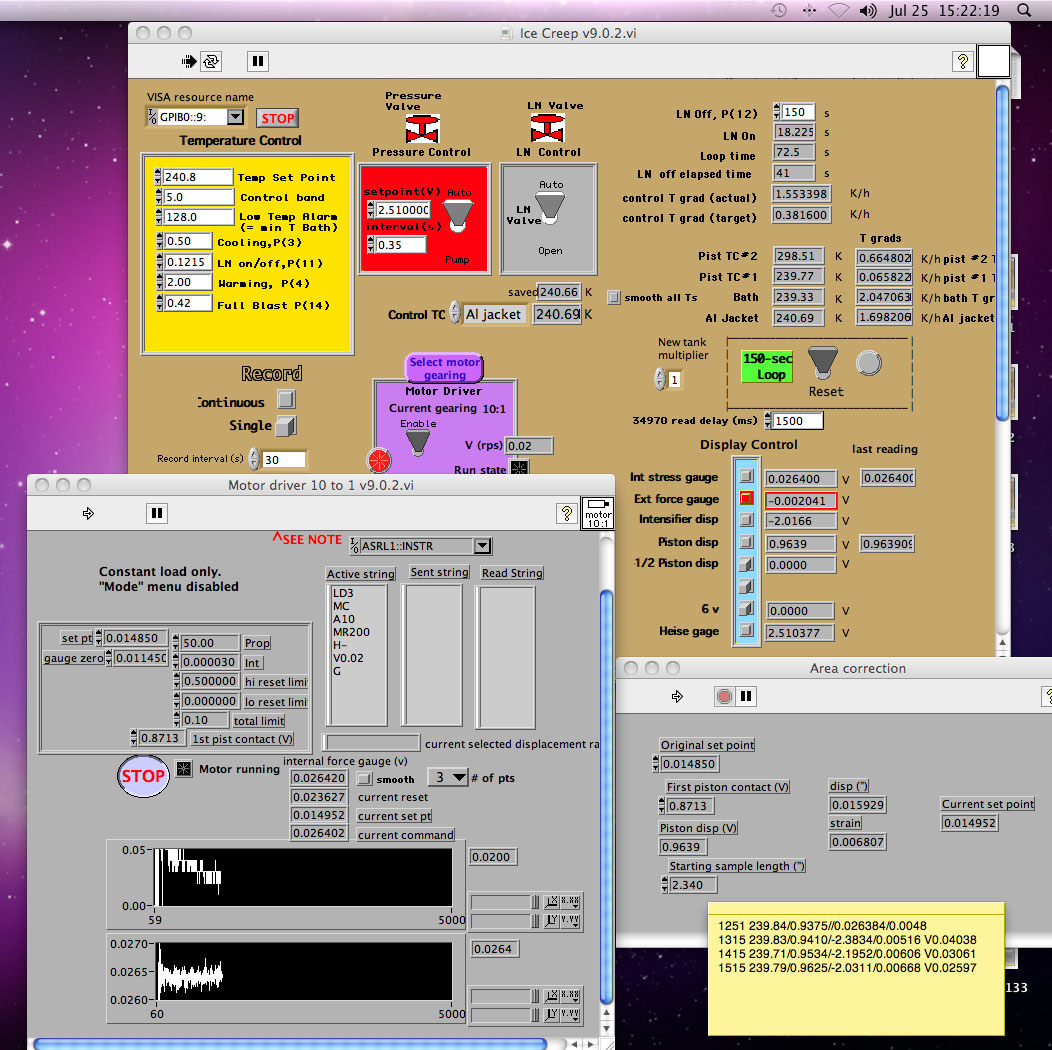
7/25/14 1522 hrs